- Published on
Estimating Pi Using Monte Carlo Simulations
- Authors

- Name
- Danial Khosravi
- @danial_kh
Pi (3.141593) is one of the few magical numbers in Mathematics that we often trust, accept and use in our calculations. However, you might be curious to know where it comes from. Pi can be obtained analytically which gives us a value equal to 3.141593 but here we're going to find the value of pi numerically by running Monte Carlo simulations.
As you might remember from primary or elementary school, the formula to obtain the area of a circle is:
where is the radius of the circle. So if we have a circle with , then its area is just !
Now imagine we have a circle inside a square with sides equal to 2 and if we look at a corner of it, we see that of the area of the circle is inside a square with sides equal to 1. So we know the area of that slice of circle is .
So if we denote the area of the quarter of the circle as and we know:
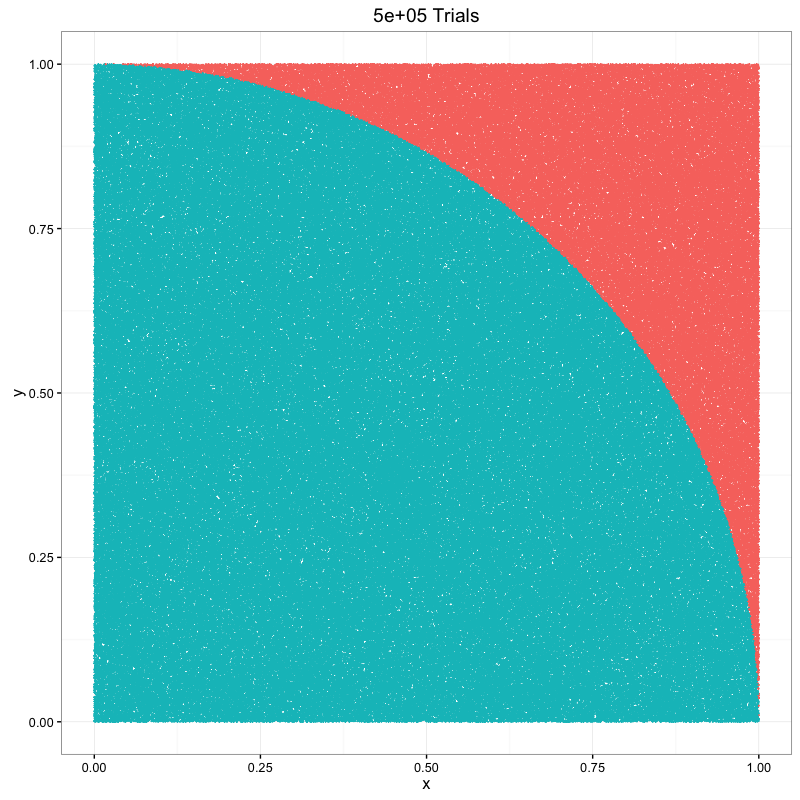
Now, using Monte Carlo simulations, we generate a large number, lets say a million, and coordinates that are uniformly distributed and using the pythagorus formula we find their distances from the centre of the circle
If our is smaller than the radius of the circle, , then it's inside the circle and vice versa. If we run enough simulations, then the proportion of points that are inside the circle to the total number of trials would essentially give us the area of that slice of the circle, .
For a circle with , if we multiply that area by 4, using the formula above, we get our estimate for .
Plot of 500,000 simulations
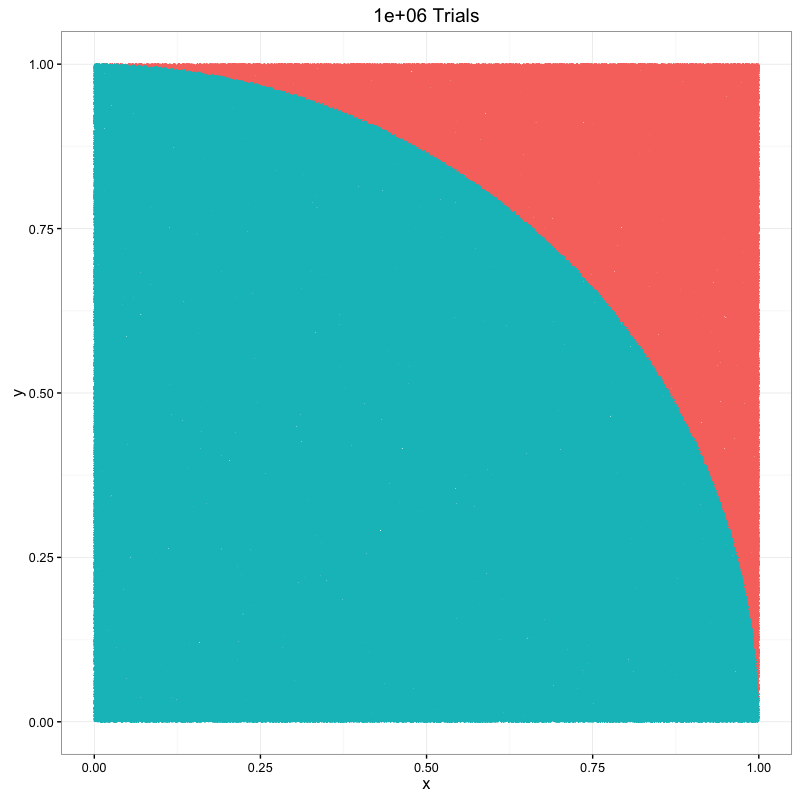
Plot of 1,000,000 simulations
Code
library(ggplot2)
trials <- 1000000

r <- 1
x <- runif(trials, 0, r)
y <- runif(trials, 0, r)

distance_from_center <- sqrt(x^2 + y^2)
inbounds <- distance_from_center < r


ggplot(data.frame(x, y, inbounds), aes(x, y, color=inbounds)) +
  theme_bw() +
  ggtitle(paste(round(trials), 'Trials')) +
  guides(color=FALSE) +
  geom_point(size=0.002) +
  ggtitle(paste(trials, 'Trials'))

pi_estimate <- 4 * sum(inbounds)/trials
pi_estimate

error = 1 - pi_estimate/pi
error